
Flicking through the ol’ Solarwinds activity monitor, I spotted this one day:
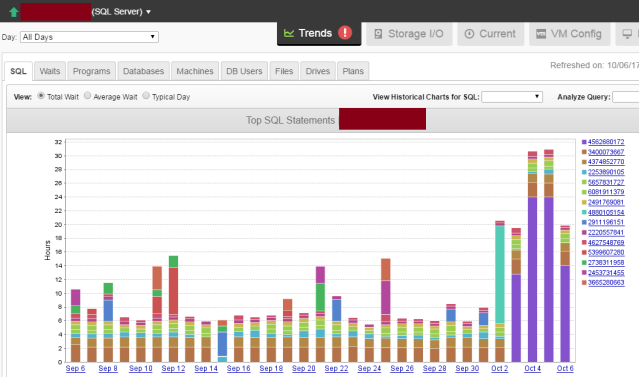
That four day purple thing on the right? Not good.
(The remaining images are from a reconstruction, partly to protect the not-so-innocent, and partly because the first job was (as always) fix the finance department’s server…)
Running Adam Machanic’s (b|t) excellent sp_WhoIsActive gave us the following:
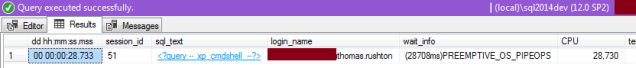
Except, in reality, the first column was over 3 days, and the wait_info & CPU fields were waaaay higher. And the login_name field gave me the name of the perpetrator.
I wanted to know what he was up to, but the sql_text field only gives “xp_cmdshell”, not anything useful that might help to identify what went wrong.
So we have to go to Taskmanager on the server. On the “Process Details” page, you can select which detail columns you want to see. We want to see the Command Line, as that’ll tell us if it’s some manually-launched batch job that’s failed or something else going wrong.

Click on OK, and find the process (in this case, the only process) named “cmd.exe” that’s been launched by the SQL Server service.

Oh my. Launching “calc.exe”? Why?
But this shows just what can go wrong if you don’t think about what you’re doing when launching xp_cmdshell – it can (and does) give you the ability to launch anything – and the problem with that is that you can’t control applications with a User Interface when they’re launched from a service account on a server – all you can do is hope you find what you’ve done, and that you can kill it.
…which I could, in this case. Fortunately, the only harm in this case was a red face (not mine, for a change).


Pingback: Tracking Down Long-Running xp_cmdshell Processes – Curated SQL